Stocks Up, VIX Up?
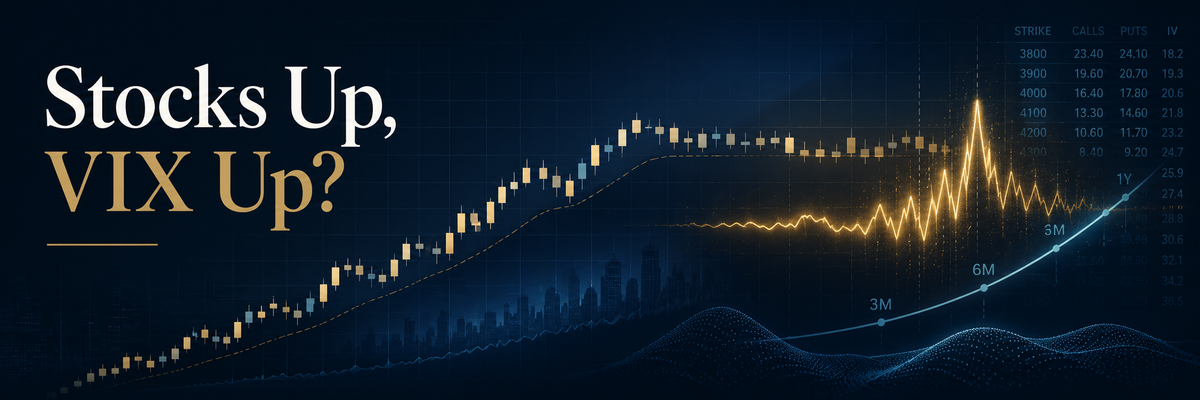
July has historically delivered positive equity returns alongside a rising average VIX. The explanation is not that stocks and fear normally rise together. The gains tend to arrive first, while volatility reprices later.

July creates a strange headline.
Since 1990, the S&P 500 has gained an average of 1.46% during July. Over the same period, the VIX has increased by an average of 4.90%.
Stocks up.
VIX up.
At first glance, the two statistics appear to contradict each other. The S&P 500 is advancing, but the market's best-known measure of expected volatility is rising with it.
That is not how the relationship is supposed to work.
The VIX generally moves in the opposite direction of the S&P 500. When stocks decline, demand for protection typically increases and the VIX rises. When stocks advance calmly, the VIX usually falls.
July does not overturn that relationship.
It reveals something more interesting about timing.
The Average Hides the Sequence
We reviewed the 36 completed Julys from 1990 through 2025 using daily S&P 500 price-index closes and Cboe VIX closes.
The S&P 500 finished July higher 23 times, or 63.9% of the sample. The VIX finished higher 19 times, or 52.8%.
But they finished higher together only seven times.
That is 19.4% of all Julys.
Even among the 23 positive stock-market Julys, the VIX rose in only seven. The month-to-month correlation between S&P 500 returns and VIX changes remained strongly negative at approximately -0.69.
The apparent paradox comes from combining two averages that were often produced at different times.
During the first half of July, the S&P 500 gained an average of 1.44% while the VIX declined 1.59%.
During the second half, the S&P 500 was almost flat, gaining an average of just 0.04%, while the VIX increased 7.10%.
The sequence matters.
Stocks up first.
VIX up later.
Nearly all of July's average equity return arrived during the first half of the month. The average increase in expected volatility arrived during the second.
This is not a dependable trading rule. Thirty-six observations are a limited sample, and VIX changes are highly variable. But the pattern provides a useful framework for understanding why a positive month can finish with more expensive protection than it started with.
The VIX Is Forward-Looking
The VIX is often described as the market's fear gauge.
That description is convenient, but incomplete.
The VIX is a calculation based on S&P 500 option prices. It estimates the magnitude of movement the options market is pricing over the next 30 days. It does not forecast whether the market will move up or down.
The time horizon is the important part.
At the beginning of July, the VIX is looking mostly at July. By the end of July, it is looking mostly at August.
Historically, July has been one of the calmest months for realized and implied volatility. August has been less calm. As the 30-day measurement window moves forward, investors may begin paying for risks that do not belong to July at all.
This also helps explain why the percentage change can sound larger than the economic change.
Across the 1990-2025 sample, the average July VIX increase was 4.90%. In index points, however, the average increase was only 0.40. The median increase was 0.26 point.
A move from 15 to 15.75 is a 5% increase.
It is not panic.
It is a modest repricing from a low base.
Investors Can Stay Long and Buy Protection
Investors do not have to sell equities to become more defensive.
They can remain invested while buying index puts, selling upside calls to finance downside protection, or otherwise changing the shape of their option exposure.
That can create a market in which spot prices and implied volatility rise together.
Cboe documented exactly this dynamic during a 2026 rally to record highs. Its decomposition found that the increase in VIX was driven by higher fixed-strike volatility and risk-reversal positioning. Investors were selling upside calls to help finance downside protection.
The market was still advancing.
The price of insurance was advancing too.
This distinction matters because market direction and risk pricing are separate variables.
Stock prices tell us where capital is being marked today. Option prices tell us what investors are willing to pay for the range of outcomes ahead.
Those variables are related, but they do not always move together.
Earnings Create Volatility Beneath the Index
July is also an earnings month.
Many of the market's largest companies report during the second half of July. Their options begin pricing the potential magnitude of those announcements before the results arrive.
That does not automatically mean the VIX must rise.
Earnings often create single-stock volatility rather than index volatility. One company beats expectations. Another misses. One sector rises while another falls. When those moves offset each other, dispersion can be high even while the index remains calm.
The missing variable is correlation.
When companies move independently, diversification suppresses index volatility. When a common factor such as rates, inflation, liquidity, or geopolitics begins moving them together, expected correlation rises and the same collection of stocks can produce much more index-level risk.
This is why the index alone can be misleading.
A calm S&P 500 can contain violent movement underneath. A positive monthly return can contain a meaningful drawdown. A rising VIX can reflect more expensive protection without signaling broad liquidation.
July 2024 was a useful example.
The S&P 500 finished the month up 1.13%. The Russell 2000 gained approximately 10.1%, and the Dow gained approximately 4.4%. Yet the VIX rose from 12.44 to 16.36, an increase of 31.5%.
The percentage change looked dramatic. The point change was 3.92.
The month was not a conventional risk-off episode. It was a rotation. Capital moved away from parts of mega-cap technology and toward smaller, more rate-sensitive companies. The broad market finished higher, but the path became less certain and index protection became more expensive.
VIX was not pricing the destination alone.
It was pricing the path.
What July 2026 Is Telling Us
As of the July 16 close, the S&P 500 was up approximately 0.46% from June 30.
The VIX had increased from 16.45 to 16.73. That was a 1.7% increase, but only 0.28 point.
So far, 2026 fits the "stocks up, VIX up" description.
Only marginally.
The more important observation is what the current 30-day volatility window contains.
Second-quarter earnings expectations entered the season at an unusually high level. S&P 500 earnings were expected to grow 23.3% from the prior year. Estimates increased 3.4% during the quarter, compared with a normal pattern in which analysts reduce estimates as the reporting date approaches.
Strong results are expected.
That raises the bar for what counts as a positive surprise.
The same 30-day window also contains the July 28-29 Federal Reserve meeting, the advance second-quarter GDP report on July 30, the August 7 employment report, and the August 12 CPI release.
Investors can remain constructive on earnings and economic growth while paying more to protect against the range of outcomes around those events.
Optimism and protection are not opposites.
They can exist in the same portfolio.
The Portfolio Engineering Lesson
The lesson is not to buy volatility because the calendar says July.
The VIX itself is not directly investable. VIX futures, options, and exchange-traded products have their own term structure, carry, mean-reversion, and implementation risks. A seasonal average is not a substitute for understanding those instruments.
The more durable lesson is that a rising market is not necessarily becoming safer.
Expected return and path risk are different dimensions of the portfolio. Market participation addresses the first. Position sizing, diversification, optionality, and explicit risk constraints address the second.
This is why we do not treat volatility as an afterthought.
Protection is most useful when it is designed before uncertainty becomes obvious. Once the market is already in distress, the price of protection usually reflects that distress.
Our objective is not to forecast the exact day volatility will rise. It is to engineer portfolios that can continue operating when the market's direction, leadership, correlation, and cost of protection change.
July's history illustrates that challenge clearly.
The index can rise.
The VIX can rise.
The market can remain constructive while becoming less certain about the path ahead.
The clean takeaway is this:
A rising market can still be buying protection.
Engineered compounding,
Deniz Erkan
This communication is for informational purposes only and does not constitute an offer to sell or a solicitation of an offer to buy any security. Any offer or solicitation will be made only pursuant to definitive offering documents and in accordance with applicable law. Historical market patterns and past performance do not guarantee future results. Options and volatility-linked products involve risk and are not suitable for all investors.
Research and Data Sources
- Cboe VIX Index Historical Data: https://www.cboe.com/tradable_products/vix/vix_historical_data
- S&P 500 historical price-index closes: https://finance.yahoo.com/quote/%5EGSPC/history/
- Cboe VIX FAQ and methodology overview: https://www.cboe.com/tradable_products/vix/faqs
- Cboe, "Spot Up, VIX Up" as Investors Hedge Record Highs in US Equities: https://www.cboe.com/insights/posts/spot-up-vix-up-as-investors-hedge-record-highs-in-us-equities
- Cboe, Inside Volatility Trading: A Day, A Week, A Year, A Decade: https://www.cboe.com/insights/posts/inside-volatility-trading-a-day-a-week-a-year-a-decade
- StoneX July 2026 market seasonality review: https://www.stonex.com/en/insights/july-2026-market-seasonality-buy-in-july-when-the-sun-is-high-in-the-sky/
- FactSet S&P 500 Earnings Season Preview, Q2 2026: https://insight.factset.com/sp-500-earnings-season-preview-q2-2026
- Federal Reserve July 2026 calendar: https://www.federalreserve.gov/newsevents/2026-july.htm
- U.S. Bureau of Economic Analysis release schedule: https://www.bea.gov/news/schedule/
- U.S. Bureau of Labor Statistics CPI and Employment Situation releases: https://www.bls.gov/cpi/ and https://www.bls.gov/news.release/empsit.htm
Methodology note: Runtime calculations use the S&P 500 price index and Cboe VIX daily closes for the 36 completed Julys from 1990 through 2025. Full-month changes run from the final trading close in June to the final trading close in July. First-half and second-half calculations split each July into near-equal groups of trading sessions. S&P 500 figures are price returns and exclude dividends. Results are descriptive and are not presented as a forecast or trading signal.